WP2 Traceable measurement methods
This work package has studied and developed optical and electrical measurement methods for novel SSL products and components, including traditional and affordable SSL products aimed at home use, as well as more advanced novel technologies, such as large-area and flexible OLEDs and 3D LEDs. Below, some of the key achievements of WP2 are described.
Impedance stabilization network for electrical power measurements
In typical testing of new SSL products coming to market, the luminous flux (lm) produced by the light source and active electrical power (W) consumed by the light source electronics are measured to obtain information of the luminous efficacy (lm/W) of the product. This is used as an input for determining the energy classification of the products, after which decision can be made whether the product enters the market or not, or if another product in development will be chosen instead. The methods used in testing of typical SSL products are described in standards, such as the CIE S025 or IES LM79. In a typical measurement, the luminous flux of the SSL product is measured using an integrating sphere photometer or a goniophotometer, and the electrical power consumption is measured using a commercial power meter or analyser.
 |
Measuring the power consumption of an SSL product is heavily dependent on the quality of the power meter used (bandwidth, connections, measurement settings, etc.), the topology of the AC/DC converter used (stability, harmonic content etc.) in the device under test (DUT), as well as the source impedance of the AC voltage source used for supplying the operating voltage for the DUT during the testing. The challenges of power measurements have been noticed by various laboratories working in the field of SSL testing and metrology, as well as in the project EMRP ENG05 Metrology for Solid-State Lighting. In the project Lighting, it was established that the source impedance and the presence of harmonics in the AC voltage source prevented repeatable measurements of the RMS current, power factor and electrical power consumed by SSL devices at different laboratories. This is problematic in characterisation of luminous efficacy (lm/W) of energy-saving lighting products, as the uncertainty due to the electrical power measurement can be one of the largest sources of uncertainty. To solve this problem, a source impedance stabilisation network is proposed to be placed between the AC voltage source and the DUT so that the DUT always sees the same source impedance, independent on what type of AC voltage source is used for supplying the operating voltage for the DUT in the measurements.
The project MESaIL has investigated the issue and developed an impedance stabilisation network (ISN) that aims to stabilize the output impedance of an AC voltage source in such a way that AC voltage sources from different manufacturers can be more reliably used while obtaining more similar measurement results of electrical parameters at different laboratories, thus reducing the sensitivity of the electrical measurement to the properties of the AC voltage source used. The ISN developed in the project MESaIL is shown in Figure 2.
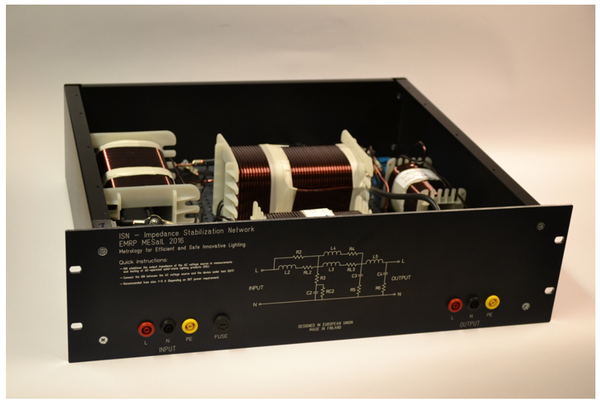 |
The ISN is a passive network that consists of high quality air core inductors, film capacitors and resistors. It has some similarities with the LISN and AMN networks used in EMC and harmonics testing of electrical devices. However, due to the fact that in testing of SSL products the DUT is operated from an AC voltage source with limited current supply capability, as compared to a typical outlet of a room that are used in EMC testing, the power consumption of the ISN was optimized in such a way that all typical AC voltage sources found in laboratories can be used, starting with sources having about 300 VA output power capability. The ISN has been tested with operating voltages up to 250 VAC (RMS), and can be used in testing of DUTs up to several hundred watts of active power consumption. Therefore, the ISN is suitable for measurements of all typical LED lamps and luminaires, including the largest LED street lamps available on the market. When connected to an AC voltage source with 230 VAC (RMS) output, the ISN will consume about 5 W of active power and 110 var of reactive power, when no DUT is connected. The power consumption will slightly increase, when a DUT is connected, but the added power consumption is small.
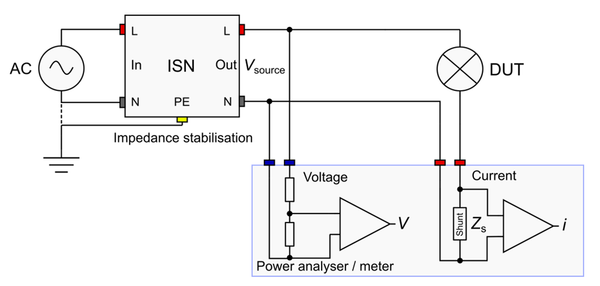
The electrical connection of the ISN to a measurement setup is shown in Figure 3. The output of the AC voltage source is connected to the input of the ISN and the output of the ISN forms the new impedance stabilized AC voltage source output. During testing, the voltage of the ISN output should be regarded as the output of the AC voltage source. The power meter should be connected between the ISN and the DUT to avoid measuring the power consumed by the ISN. As written in the CIE S025 standard, the test voltage should be measured over the DUT. ISN is fully compatible with this wiring method as well. It is always the responsibility of the laboratory to characterise the measurement configuration, including wiring, and adjust the test voltage accordingly. When adjusting the test voltage, it is practical to measure the AC supply voltage at the output terminals of the ISN.
 |
Adding an ISN to a measurement setup will reduce temporal fluctuations of all electrical parameters monitored, and reduces resonant states and high harmonic content of some SSL products tested that are otherwise observed in measurements without the ISN. The ISN will also make possible to measure SSL products with wide harmonic bandwidth using more affordable electrical power meters. A total of four ISNs were constructed in the project MESaIL and their impedance curves were characterised up to 5 MHz frequency. The most important operating range of the ISN is between 50 Hz and 1 MHz.
Advanced metrology for OLED technology
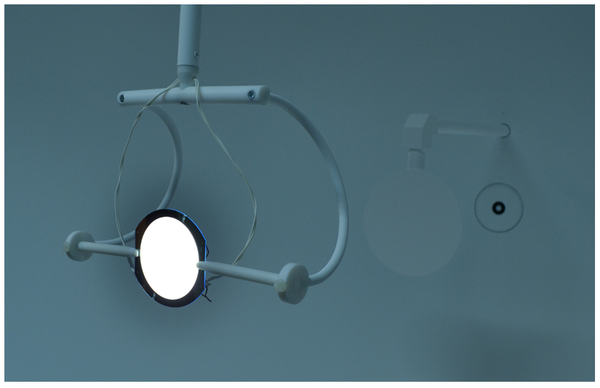
An analysis procedure for reducing uncertainties in radiance and luminance measurements of OLEDs using near-field camera goniometers has been developed. Luminous flux and spectral radiant flux measurements of OLEDs in different geometrical alignments have been studied for determining the typical self-absorption, as well as angular and spectral errors and uncertainties in measurements of OLEDs with integrating spheres. 2pi and 4pi sphere geometries have been studied using spheres of different sizes. A commercial sphere scanner was modified and used for mapping of spectral throughput of an integrating sphere. For validation of the results, a far-field mirror goniophotometer was used. A special sample holder was developed that allows measurement of OLEDs and other SSL panels in difference geometrical conditions using an integrating sphere. A photograph of an OLED attached to the holder is shown in Figure 4.
 |
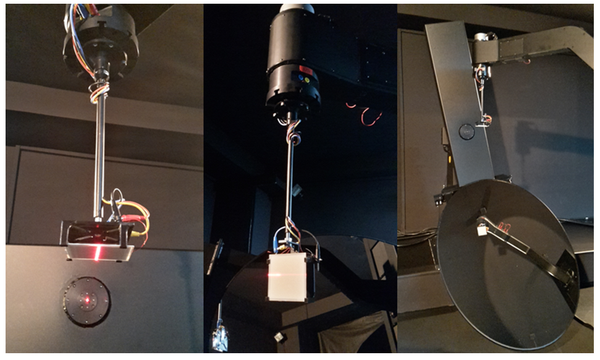
Comparison of luminous flux measurements of a group of three different OLEDs using a 4pi integrating sphere, 2pi integrating sphere and a far-field mirror goniophotometer showed that integrating spheres can be used for measurements of OLED panels with low uncertainty, if the spectral and spatial corrections are applied. Uncertainties at a level of 1 % (k = 2) at NMIs can be achieved with stable OLED samples. The largest difference in the luminous flux measured for a group of different OLEDs in vertical and horizontal operating orientation was 1.3 %. This may indicate some internal operational changes due to different temperature distribution. The influence of edge-emission of OLEDs was investigated as well. In most cases, the relative amount of luminous flux emitted by an OLED via its edges was less than 0.05 % of the total luminous flux measured. In typical testing of OLEDs for luminous flux and efficacy, the edge-emission can be considered as a negligible effect. In most cases the stability and repeatability of the OLEDs can have a more significant effect on the results. When using a far-field goniophotometer, the signal levels measured at large angles may be challenging in measurement of OLEDs. Therefore, a near-field imaging goniophotometer, or an integrating sphere photometer might be a more practical measurement system for integrated parameters, such as luminous flux. For angular data, a goniophotometer needs to be utilized. The mirror goniophotometer used in the measurements is shown in Figure 5.
 |
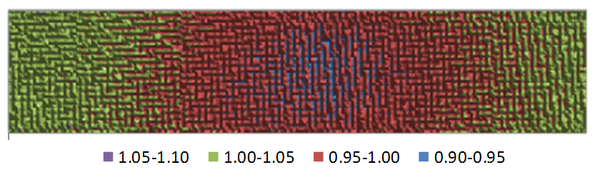
Optical and electrical performance of flexible OLEDs was investigated under the influence of bending of an OLED. The results indicate that after bending, the luminance of the centre part decreases, but the luminance of the outer edges increases. The variation is in the range between -9 % and 10 %. The harmonic distribution (dc-5000th Harmonic) data is also analysed. The bend has no influence on the harmonic distribution on the ac input side. Figure 6 shows the relative difference in perceived luminance on the bent OLED surface.
 |
Characterisation methods for 3D nano LEDs
In this project, packaged devices with an ensemble of 3D core-shell LED columns as well as 3D structured axial LEDs using a ILMD and a near-field goniophotometer were investigated giving valuable insight to the pattern, directionality, and overall efficiency of the emission of the devices. Emphasis was put on the behaviour of luminous flux versus driving current of the device, in addition to the work plan this was also discussed with respect to its heat sink temperature. The measurement setup was extended by two manipulators enabling on-wafer measurements of not completely processed (or not packaged) LED wafers and dies, which speeds up the feedback loop for verification of device processing schemes (see Figure 7). A hexagonal luminous intensity distribution was found for all investigated devices with ensembles of 3D core-shell LED columns which is assigned to the ensemble geometry. Along with the integral electroluminescence emission (EL) also the absolute luminous and radiative efficiency characteristic could be derived, resulting in an external quantum efficiency (EQE) maximum in the range of 10 %.
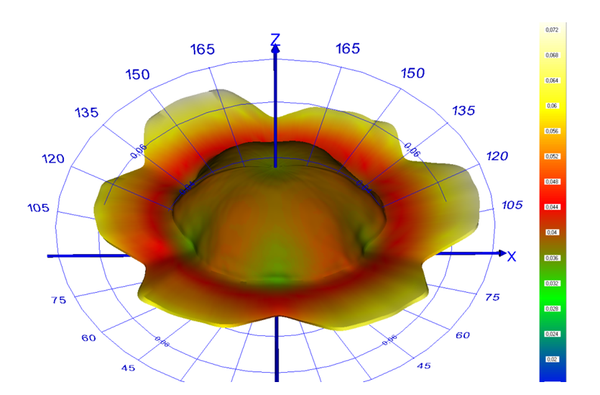 |